


CS2 Market Trends
Price movements, confirmed sales and market breadth across every CS2 skin we track, measured once a day on our reference price and filterable down to the weapon, knife, glove or collection you care about. Every list comes as cards or as a sortable table.
- 24H to 90D windows
- Daily reference prices
- Steam + CSFloat sales
- Live market depth
- Every view is a shareable link
Measuring skins. Cases and stickers have their own pages: case & container trends · sticker trends.
Market overview
Mixed market — 39% up, 47% down over the last 7 days.
Skin index · median tracked skin, last 90 days, first day = 100
| Day | Index | Median price |
|---|---|---|
| 2026-06-05 | 100 | $94.81 |
| 2026-06-06 | 99.38 | $94.22 |
| 2026-06-07 | 99.79 | $94.61 |
| 2026-06-08 | 99.47 | $94.31 |
| 2026-06-09 | 98.9 | $93.77 |
| 2026-06-10 | 97.71 | $92.64 |
| 2026-06-11 | 97.37 | $92.32 |
| 2026-06-12 | 97.1 | $92.06 |
| 2026-06-13 | 97.19 | $92.15 |
| 2026-06-14 | 97.33 | $92.28 |
| 2026-06-15 | 97.46 | $92.40 |
| 2026-06-16 | 97.19 | $92.15 |
| 2026-06-17 | 97.52 | $92.46 |
| 2026-06-18 | 96.35 | $91.35 |
| 2026-06-19 | 96.12 | $91.13 |
| 2026-06-20 | 95.78 | $90.81 |
| 2026-06-21 | 95.85 | $90.88 |
| 2026-06-22 | 95.48 | $90.52 |
| 2026-06-23 | 95.49 | $90.53 |
| 2026-06-24 | 94.79 | $89.87 |
| 2026-06-25 | 94.9 | $89.97 |
| 2026-06-26 | 94.8 | $89.88 |
| 2026-06-27 | 94.65 | $89.74 |
| 2026-06-28 | 94.49 | $89.59 |
| 2026-06-29 | 94.22 | $89.33 |
| 2026-06-30 | 94.26 | $89.37 |
| 2026-07-01 | 94.42 | $89.52 |
| 2026-07-02 | 94.33 | $89.43 |
| 2026-07-03 | 95.39 | $90.44 |
| 2026-07-04 | 95.63 | $90.67 |
| 2026-07-05 | 95.35 | $90.40 |
| 2026-07-06 | 96 | $91.02 |
| 2026-07-07 | 95.48 | $90.52 |
| 2026-07-08 | 95.93 | $90.95 |
| 2026-07-09 | 98.03 | $92.95 |
| 2026-07-10 | 98.58 | $93.46 |
| 2026-07-11 | 98.4 | $93.29 |
| 2026-07-12 | 98.35 | $93.25 |
| 2026-07-13 | 97.35 | $92.30 |
| 2026-07-14 | 97.25 | $92.20 |
| 2026-07-15 | 97.73 | $92.66 |
| 2026-07-16 | 97.46 | $92.40 |
| 2026-07-17 | 96.94 | $91.91 |
| 2026-07-18 | 96.79 | $91.77 |
| 2026-07-19 | 96.77 | $91.75 |
| 2026-07-20 | 97.18 | $92.14 |
| 2026-07-21 | 96.78 | $91.76 |
| 2026-07-22 | 96.77 | $91.75 |
| 2026-07-23 | 96.17 | $91.18 |
| 2026-07-24 | 95.82 | $90.85 |
| 2026-07-25 | 95.92 | $90.95 |
| 2026-07-26 | 96.33 | $91.34 |
| 2026-07-27 | 96.52 | $91.52 |
| 2026-07-28 | 96.48 | $91.48 |
| 2026-07-29 | 96.22 | $91.23 |
| 2026-07-30 | 95.53 | $90.57 |
| 2026-07-31 | 95.96 | $90.98 |
| 2026-08-01 | 95.84 | $90.87 |
| 2026-08-02 | 95.8 | $90.83 |
| 2026-08-03 | 95.73 | $90.76 |
| 2026-08-04 | 97.68 | $92.61 |
| 2026-08-05 | 97.39 | $92.34 |
| 2026-08-06 | 96.55 | $91.54 |
| 2026-08-07 | 95.33 | $90.38 |
| 2026-08-08 | 95.57 | $90.61 |
| 2026-08-09 | 95.62 | $90.66 |
| 2026-08-10 | 95.96 | $90.98 |
| 2026-08-11 | 95.46 | $90.51 |
| 2026-08-12 | 95.3 | $90.35 |
| 2026-08-13 | 95.24 | $90.30 |
| 2026-08-14 | 95.24 | $90.30 |
| 2026-08-15 | 95.21 | $90.27 |
| 2026-08-16 | 94.92 | $89.99 |
| 2026-08-17 | 96.9 | $91.87 |
| 2026-08-18 | 96.55 | $91.54 |
| 2026-08-19 | 96.77 | $91.75 |
| 2026-08-20 | 97.02 | $91.98 |
| 2026-08-21 | 96.61 | $91.60 |
| 2026-08-23 | 96.12 | $91.13 |
| 2026-08-24 | 96.29 | $91.29 |
| 2026-08-25 | 95.7 | $90.73 |
| 2026-08-26 | 96.13 | $91.14 |
| 2026-08-27 | 95.55 | $90.59 |
| 2026-08-28 | 95.29 | $90.34 |
| 2026-08-29 | 95.42 | $90.47 |
| 2026-08-30 | 95.38 | $90.43 |
| 2026-08-31 | 95.11 | $90.17 |
| 2026-09-01 | 95.6 | $90.64 |
| 2026-09-02 | 95.6 | $90.64 |
| 2026-09-03 | 95.17 | $90.23 |
Volume Leaders· last 7 days
Completed sales we counted over the window: Steam Market units plus CSFloat sales. Each card says which venue counted what. Steam cannot list above $1,800, so on knives and gloves the CSFloat figure is the whole reading.
48 skins
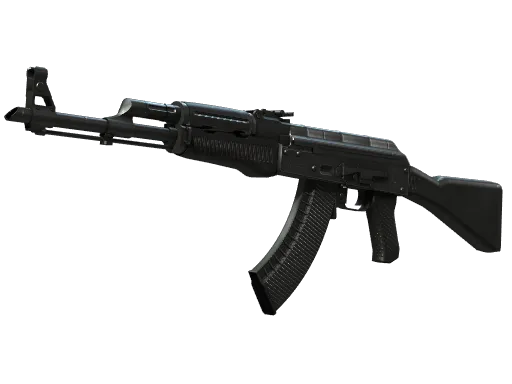
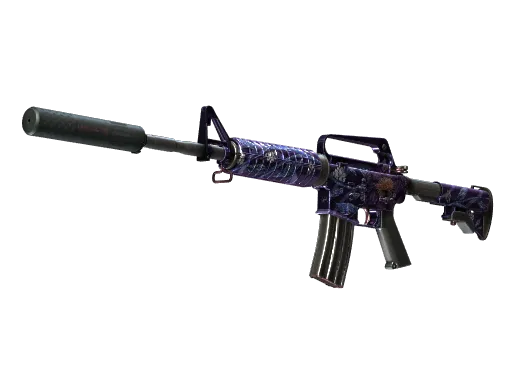
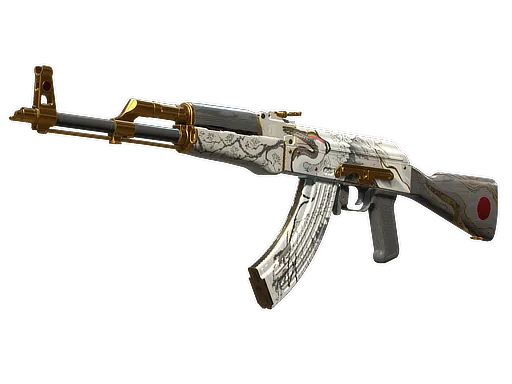
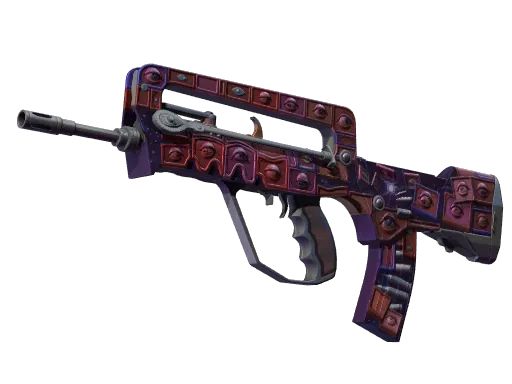
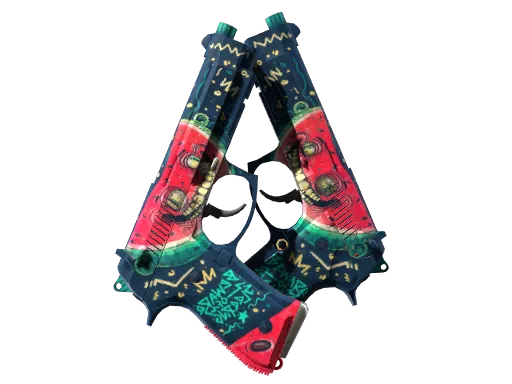
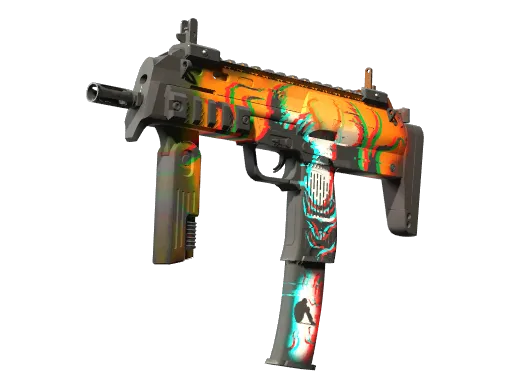
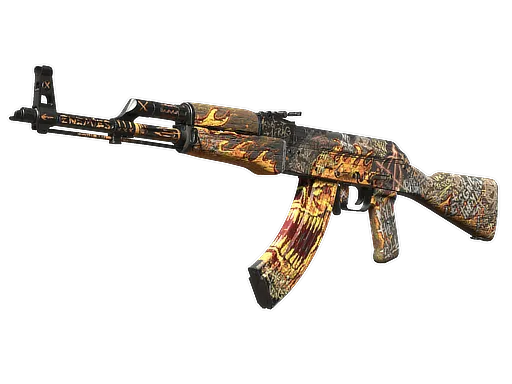
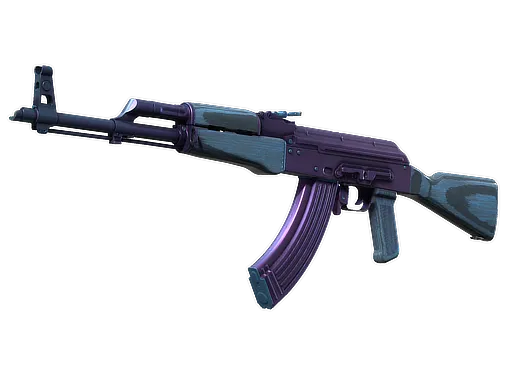
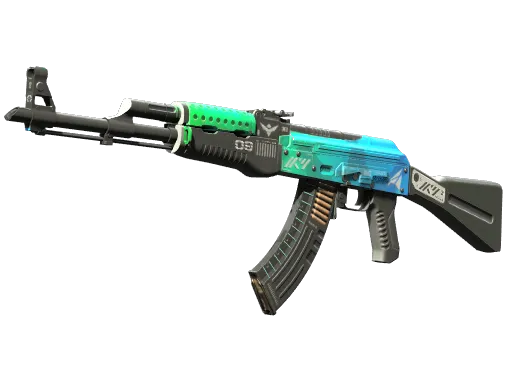
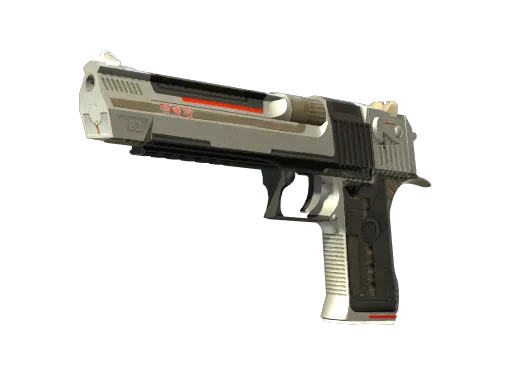
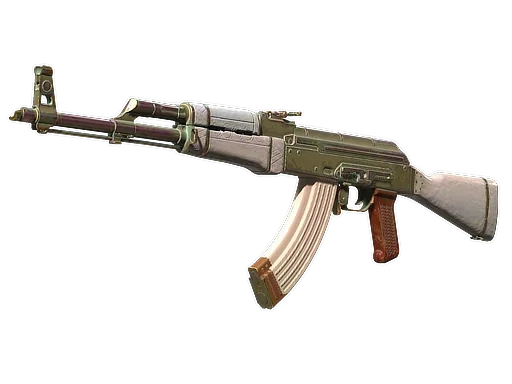
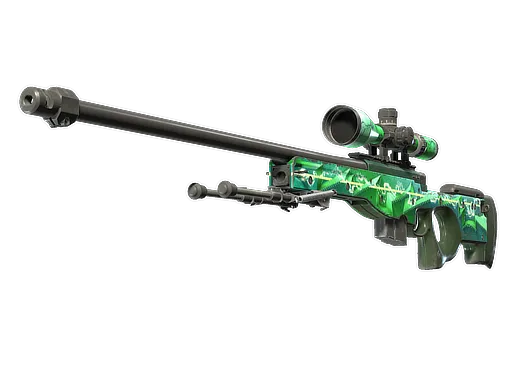
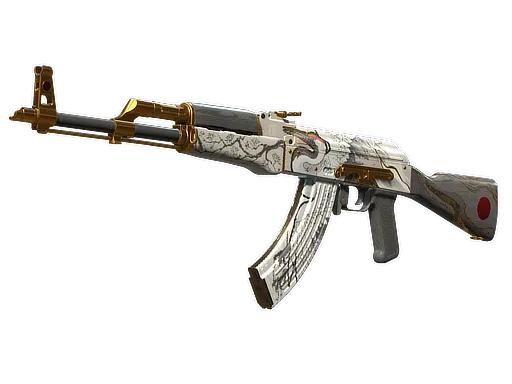
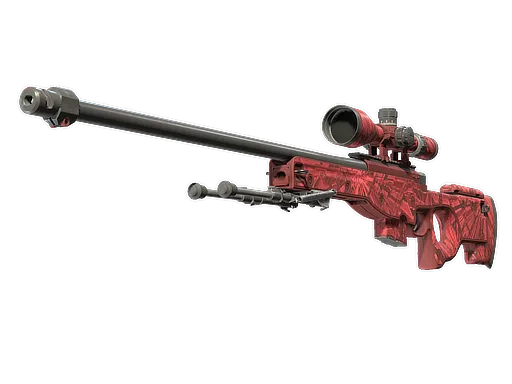
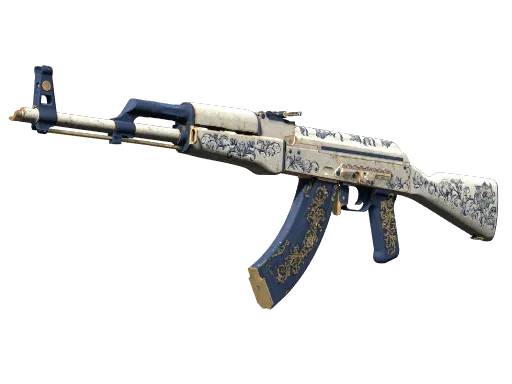
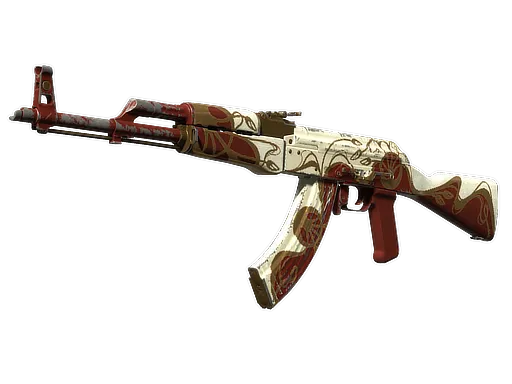
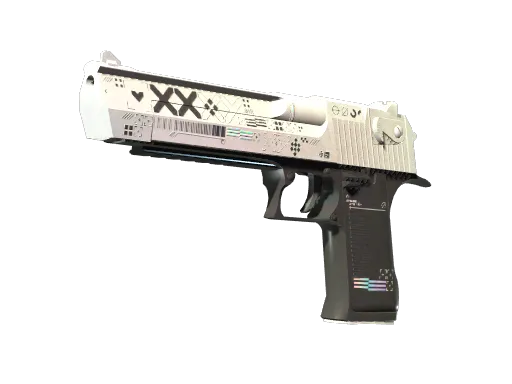
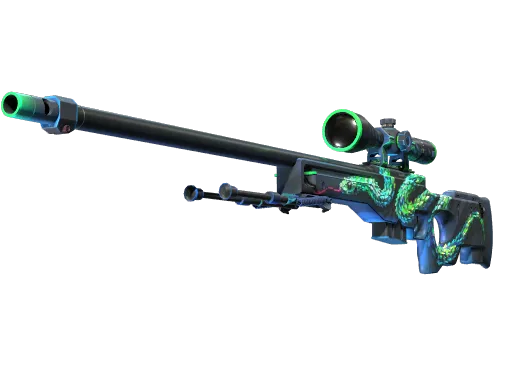
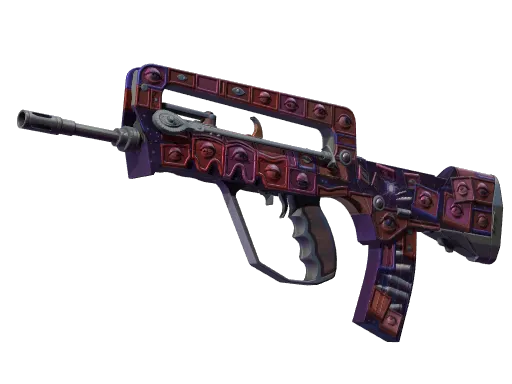
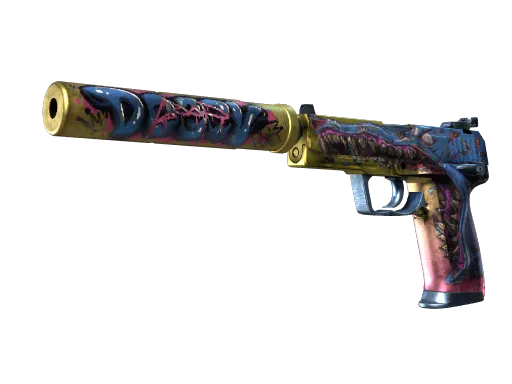
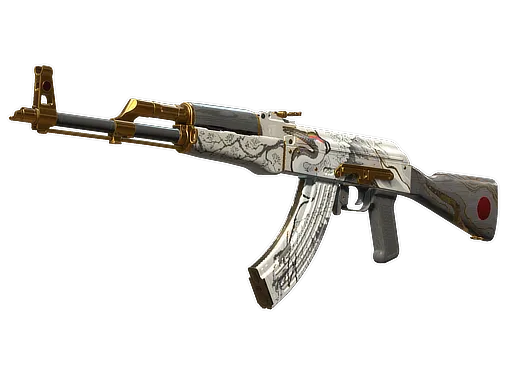
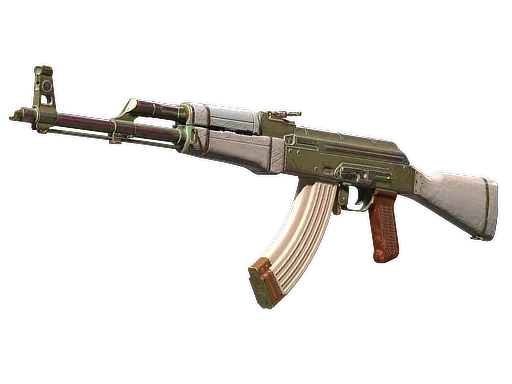
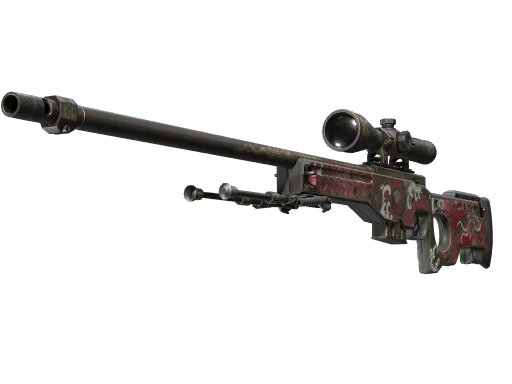
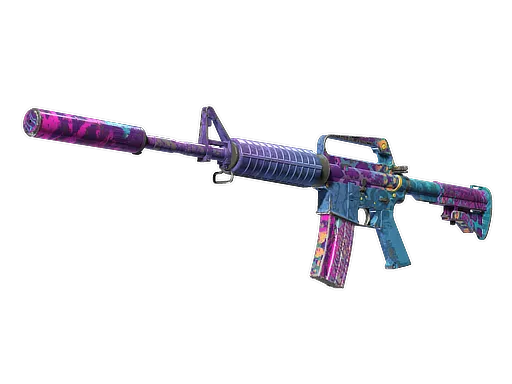
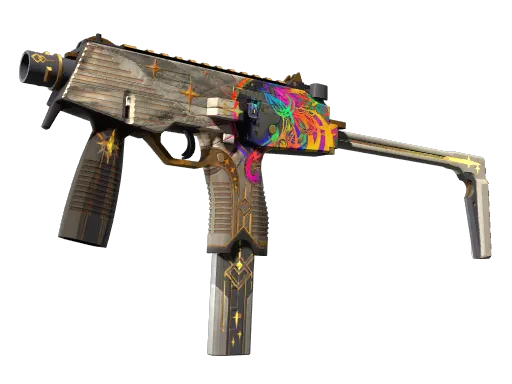
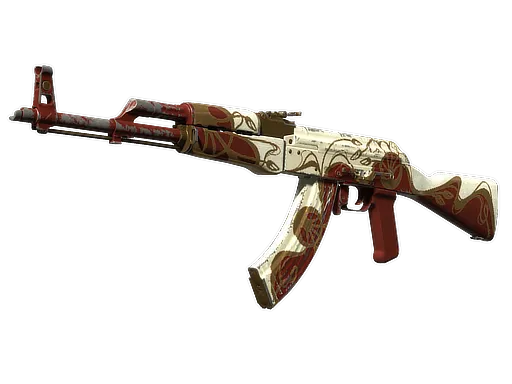
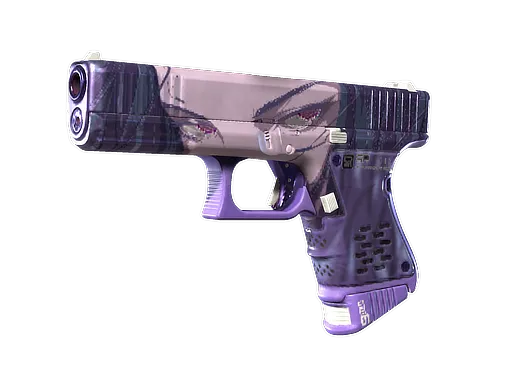
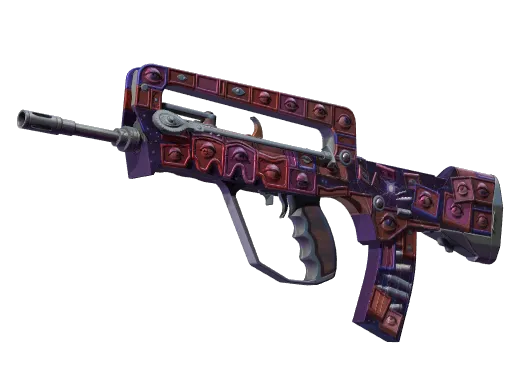
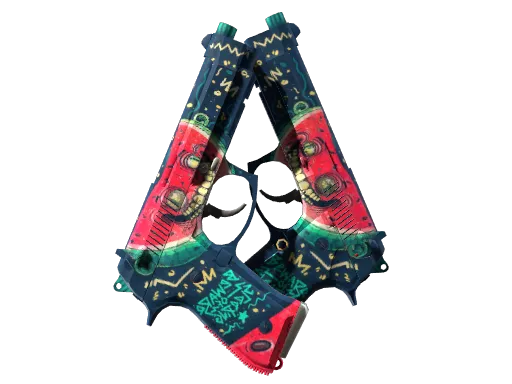
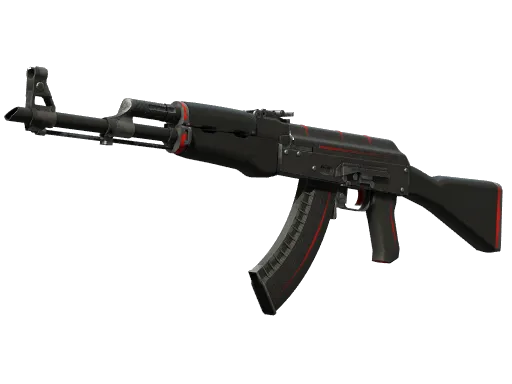
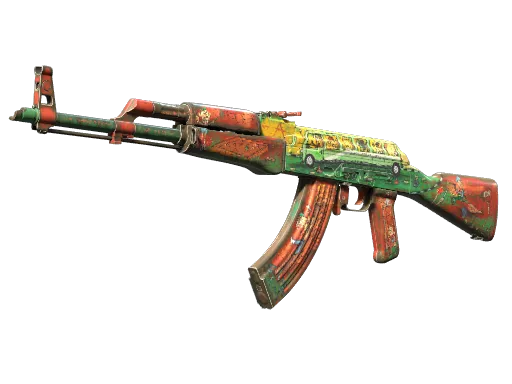
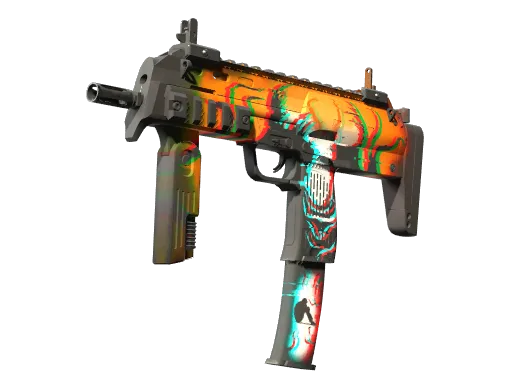

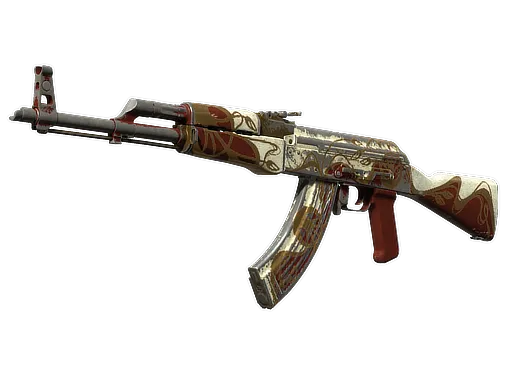
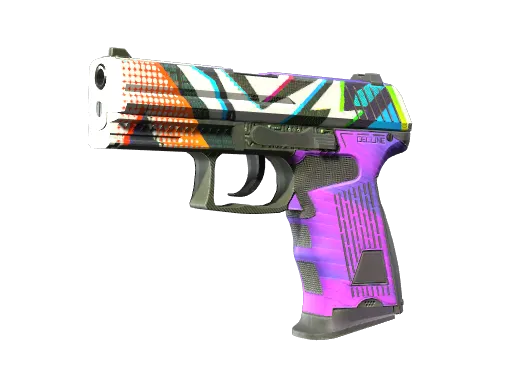
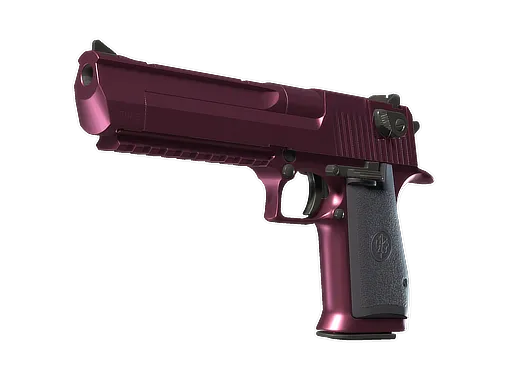
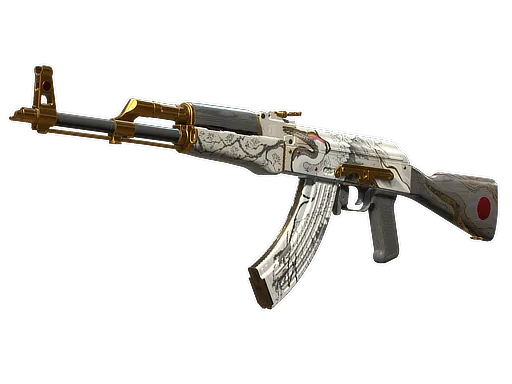
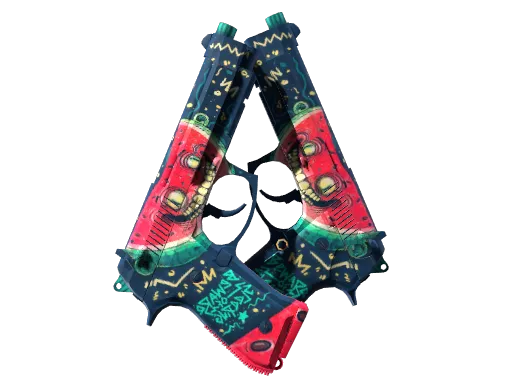
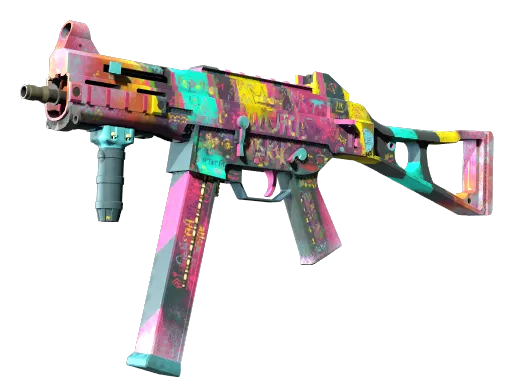
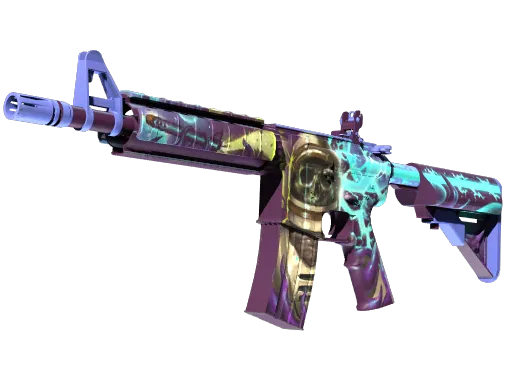
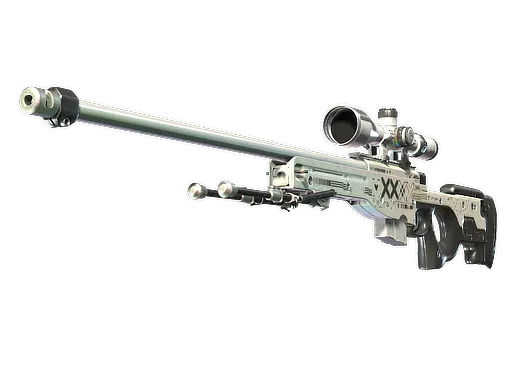
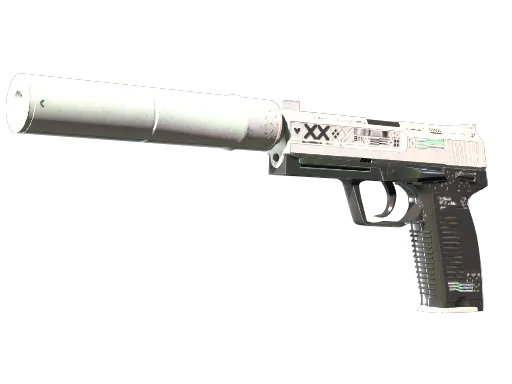
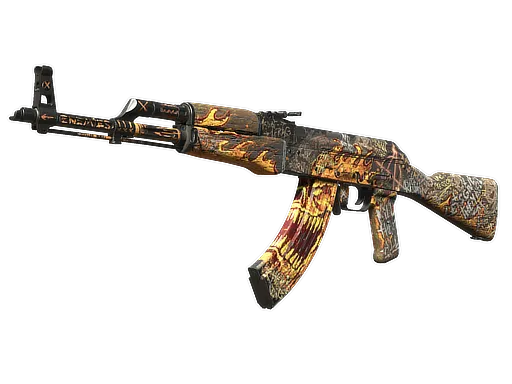
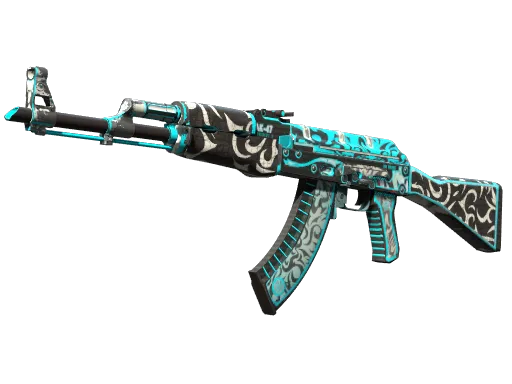
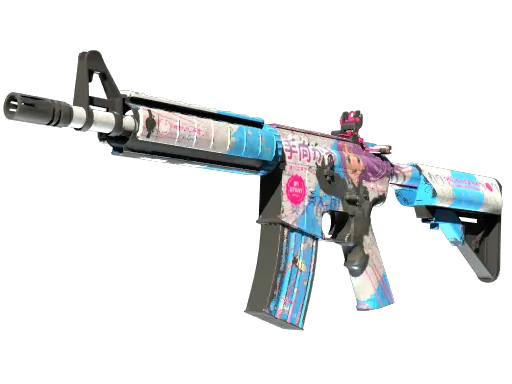
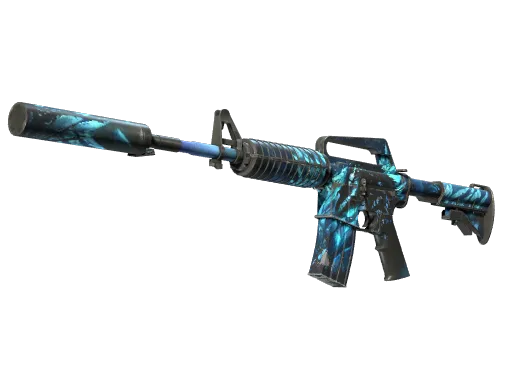
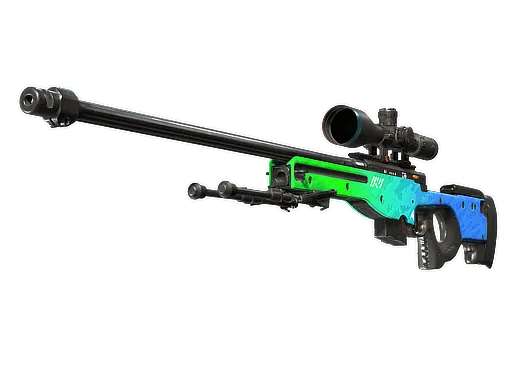
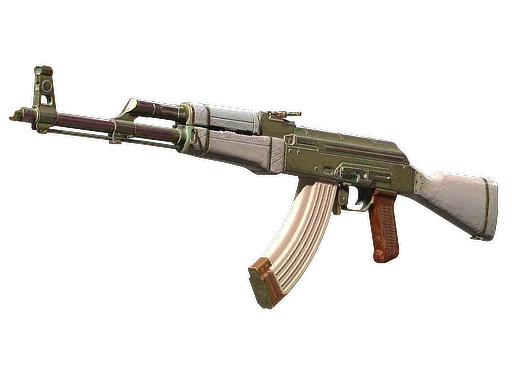
Sold counts completed sales on Steam and CSFloat over the window; a card names each venue. Items priced under $5 and moves the page cannot corroborate are left out. Listed is how many markets carry the skin right now and how many copies they hold between them.
Act on what you just found
Watch the movers
Save any skin with the heart on its card and track its price in one place instead of re-finding it here every week.
Price your own inventory
A rising market only matters if you hold it. Value your whole Steam inventory at current prices and see which of your skins moved.
Value my inventoryCheck it before you trade
A big percentage on thin volume is hard to exit. Liquidity scores show what actually sells, and Best Deals shows where it sells cheapest.
How to read this page
You are looking at Volume Leaders over the last 7 days. Here is what the numbers mean.
Where do these CS2 prices and trends come from?
One series, not a blend. Every price here is the SteamAnalyst reference price — the same number the skin page shows when you click through — recorded once a day. The percentage beside it is the change in that same series between today and the day at the far end of the window you picked. Because both come from one place, the percentage always describes the price printed next to it.
What counts as trending up or trending down?
Anything that moved more than 0.5%. Smaller moves count as flat, because the reference price is recorded to the cent and a cheap skin can cross a rounding boundary without anything happening in the market. The same reasoning keeps skins under $5 off the page entirely — below that a one-cent tick is a percentage point, and those items would own the top of every list without telling you anything.
Why is nothing up 400%?
Because a skin up 400% in a week almost never happened. The reference price is an aggregate across markets, and a jump that size in it is a lone optimistic listing, a re-listing or a recording fault — exactly the rows that used to own the top of lists like this one. So a move only ranks here once a second recorded day has roughly confirmed the price at both ends of the window, and each window has a ceiling on what it will vouch for: 30% in a day, 75% in a week, 150% in a month, 300% in a quarter. A genuine spike appears a day late; a phantom one never appears at all.
What does the "sold" figure mean?
Completed sales we counted over the window, at the two venues whose sales history we hold: Steam Market units from Steam’s own daily sales data, and completed sales on CSFloat from its sales history. Both are counts of finished sales, never listings, and each card names how many came from which venue. Steam refuses to list anything above about $1,800, so for knives, gloves and high-tier covert the CSFloat count is the whole reading. Where neither venue recorded a sale but our liquidity system measured activity, the card shows "≈ N/mo · est." — listings that left the order book over 30 days, some of which were delisted or repriced rather than sold. Where nothing was measured at all, it says "above Steam’s cap" rather than claiming the item never traded. Only complete days are counted, so a 24H figure is yesterday’s full day rather than the few hours of today that have happened so far.
What are the four small percentages on each card?
The same skin’s change over each of the four windows, measured on the same reference series, with the window you selected highlighted. They exist so a spike and a trend look different: a skin up 12% on the week and 11% on the day moved once, yesterday; one up 12% on the week, 30% on the month and 60% on the quarter has been climbing for a while. The highlighted figure is the one the list is ranked on and has passed the corroboration and ceiling gates described above; the other three are context and pass through the same arithmetic but not the gates, so an occasional one-day artefact can show there that the ranking would have refused.
What does "markets · listed" tell me?
How many marketplaces we track are carrying the skin right now, and how many copies they have listed between them, from our own market scan of the last 24 hours. It is the answer to a question a percentage cannot: is there a market here at all? A skin quoted across thirty markets with two thousand copies for sale is a different proposition from the same price quoted by two sellers, and a big move on a thin book is easier to make and harder to sell into.
How often does this page update?
The price and Steam feeds behind it write once a day, the CSFloat sales history is loaded daily from its collector, the market scan behind the listed counts refreshes every few minutes, and the page caches its working for five minutes on top of that. The stamp above the stats shows the date of the newest price we hold, not when you loaded the page — and if any feed falls behind, the page says so in a banner instead of showing you old numbers as though they were current.
Which time period should I use?
All four are real windows measured against real recorded days: 24H compares against yesterday, 90D against roughly three months ago. Use 24H for a reaction to an update or a tournament, 7D for the trend most traders watch, and 30D or 90D to separate a genuine move from noise. Longer windows cover slightly fewer skins, not more — an item has to have been priced at both ends of the window for us to measure it at all.
Containers and stickers are measured on their own pages, so they cannot own these lists: case & container trends and sticker trends. Full detail on sourcing and calculations lives in our methodology.