

CS2 Pistol Skin Liquidity — Which Pistol Skins Sell Fast
Price tells you what a skin is worth. This tells you whether you can get it. Every rating below comes from units actually traded over the last 30 days — not from price, rarity or popularity.
| # | Item | Rating | Trades / dayPer day | Listings | Spread | Price | Sell |
|---|---|---|---|---|---|---|---|
| 101 | 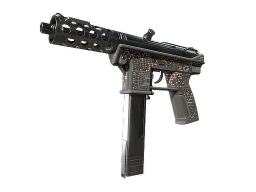 Tec-9 | PerimeterWell-Worn Tec-9 | PerimeterWell-Worn | Rarely Traded136 days of listings ahead of you | 1.40.27/day counted · CSFloat | 195 | 0.0% | $0.04 | |
| 102 | 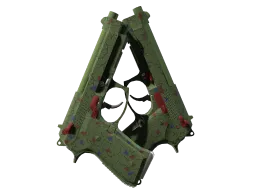 Dual Berettas | BriarSVFactory New Dual Berettas | BriarSVFactory New | Rarely Traded96 days of listings ahead of you | 2.82.1/day counted · CSFloat | 137 | 8.8% | $3.97 | |
| 103 | 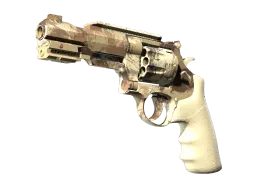 R8 Revolver | Desert BrushFactory New R8 Revolver | Desert BrushFactory New | Rarely Traded96 days of listings ahead of you | 6.70.47/day counted · CSFloat | 137 | 8.3% | $0.98 | |
| 104 | 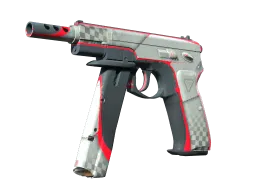 CZ75-Auto | Pole PositionFactory New CZ75-Auto | Pole PositionFactory New | Rarely Traded78 days of listings ahead of you | 4.01.7/day counted · CSFloat | 112 | 17.6% | $4.30 | |
| 105 | 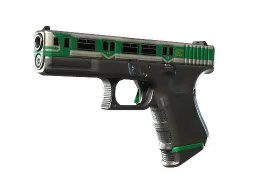 Glock-18 | Green LineSVFactory New Glock-18 | Green LineSVFactory New | Rarely Tradedbid/ask spread 55.5% · 45 days of listings ahead of you | 0.630.90/day counted · CSFloat | 65 | 55.5% | $15 | |
| 106 | 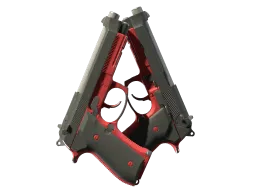 Dual Berettas | PantherField-Tested Dual Berettas | PantherField-Tested | Rarely Traded22 days of listings ahead of you | 7.13.9/day counted · CSFloat | 31 | 24.5% | $3.55 | |
| 107 | 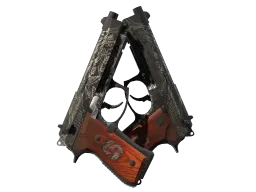 Dual Berettas | Dualing DragonsSTMinimal Wear Dual Berettas | Dualing DragonsSTMinimal Wear | Rarely Traded22 days of listings ahead of you | 7.72.1/day counted · CSFloat | 32 | 20.8% | $1.52 | |
| 108 | 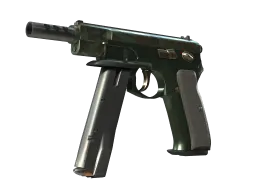 CZ75-Auto | Army SheenFactory New CZ75-Auto | Army SheenFactory New | Rarely Traded45 days of listings ahead of you | 1.50.90/day counted · CSFloat | 65 | 19.6% | $4.66 | |
| 109 |  Glock-18 | BrassField-Tested Glock-18 | BrassField-Tested | Rarely Traded73 days of listings ahead of you | 1.03.5/day counted · CSFloat | 102 | 25.3% | $27 | |
| 110 | 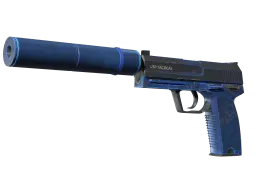 USP-S | BlueprintSTField-Tested USP-S | BlueprintSTField-Tested | Rarely Traded66 days of listings ahead of you | 7.22.6/day counted · CSFloat | 93 | 14.4% | $8.66 | |
| 111 | 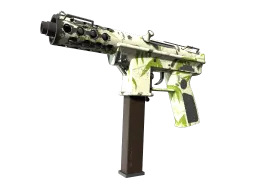 Tec-9 | Bamboo ForestField-Tested Tec-9 | Bamboo ForestField-Tested | Rarely Traded61 days of listings ahead of you | 7.31.9/day counted · CSFloat | 86 | 12.6% | $7.85 | |
| 112 | 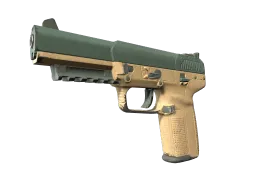 Five-SeveN | ContractorSVField-Tested Five-SeveN | ContractorSVField-Tested | Rarely Traded174 days of listings ahead of you | 3.92.0/day counted · CSFloat | 243 | 22.3% | $1.62 | |
| 113 | 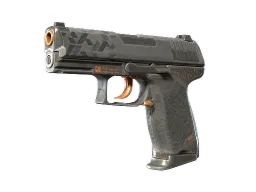 P2000 | Sure GripSTFactory New P2000 | Sure GripSTFactory New | Rarely Traded116 days of listings ahead of you | 7.31.3/day counted · CSFloat | 158 | 15.4% | $0.80 | |
| 114 | 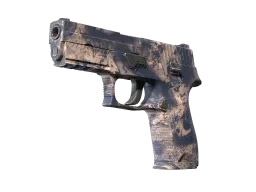 P250 | DroughtFactory New P250 | DroughtFactory New | Rarely Traded219 days of listings ahead of you | 111.3/day counted · CSFloat | 299 | 10.4% | $0.59 | |
| 115 | 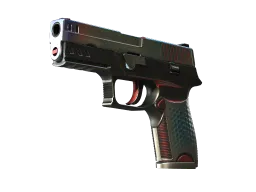 P250 | Cyber ShellFactory New P250 | Cyber ShellFactory New | Rarely Traded95 days of listings ahead of you | 5.43.3/day counted · CSFloat | 130 | 11.2% | $5.13 | |
| 116 | 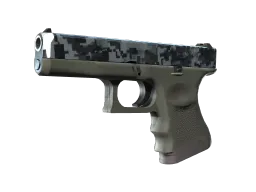 Glock-18 | Steel DisruptionSTMinimal Wear Glock-18 | Steel DisruptionSTMinimal Wear | Rarely Traded31 days of listings ahead of you | 2.62.1/day counted · CSFloat | 42 | 28.2% | $13 | |
| 117 | 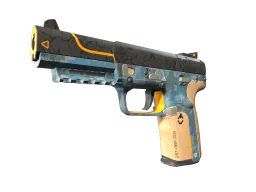 Five-SeveN | TriumvirateMinimal Wear Five-SeveN | TriumvirateMinimal Wear | Rarely Traded31 days of listings ahead of you | 4.51.9/day counted · CSFloat | 43 | 7.5% | $3.23 | |
| 118 | 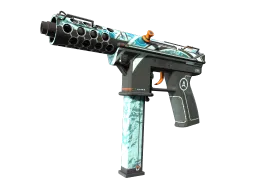 Tec-9 | AvalancheSTField-Tested Tec-9 | AvalancheSTField-Tested | Rarely Traded24 days of listings ahead of you | 5.22.6/day counted · CSFloat | 32 | 6.7% | $5.36 | |
| 119 | 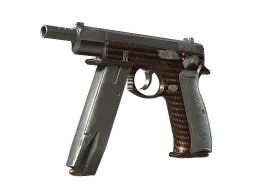 CZ75-Auto | Copper FiberSVFactory New CZ75-Auto | Copper FiberSVFactory New | Rarely Tradedbid/ask spread 45.0% · 49 days of listings ahead of you | 5.81.0/day counted · CSFloat | 65 | 45.0% | $0.34 | |
| 120 | 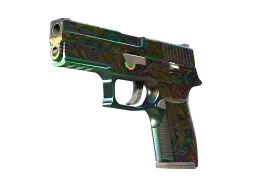 P250 | VisionsSTFactory New P250 | VisionsSTFactory New | Rarely Traded91 days of listings ahead of you | 2.52.1/day counted · CSFloat | 121 | 9.5% | $14 | |
| 121 | 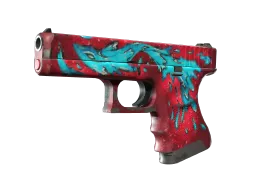 Glock-18 | Water ElementalSTField-Tested Glock-18 | Water ElementalSTField-Tested | Rarely Traded112 days of listings ahead of you | 126.7/day counted · CSFloat | 149 | 2.5% | $20 | |
| 122 |  Dual Berettas | Angel EyesSTMinimal Wear Dual Berettas | Angel EyesSTMinimal Wear | Rarely Traded29 days of listings ahead of you | 5.61.4/day counted · CSFloat | 39 | 7.4% | $3.19 | |
| 123 | 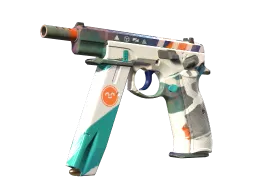 CZ75-Auto | SlalomFactory New CZ75-Auto | SlalomFactory New | Rarely Traded69 days of listings ahead of you | 1.31.2/day counted · CSFloat | 92 | 10.2% | $16 | |
| 124 | 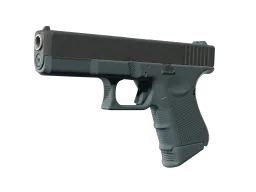 Glock-18 | NightSVMinimal Wear Glock-18 | NightSVMinimal Wear | Rarely Traded83 days of listings ahead of you | 6.13.5/day counted · CSFloat | 110 | 16.0% | $3.78 | |
| 125 |  Glock-18 | WraithsSTBattle-Scarred Glock-18 | WraithsSTBattle-Scarred | Rarely Tradedbid/ask spread 58.4% · 25 days of listings ahead of you | 9.01.1/day counted · CSFloat | 33 | 58.4% | $1.61 | |
| 126 | 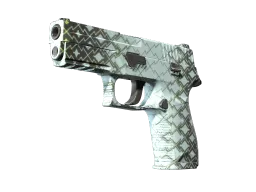 P250 | Mint KimonoMinimal Wear P250 | Mint KimonoMinimal Wear | Rarely Traded57 days of listings ahead of you | 3.01.5/day counted · CSFloat | 76 | 8.3% | $9.19 | |
| 127 | 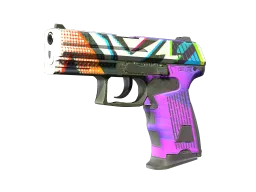 P2000 | Wicked SickSTFactory New P2000 | Wicked SickSTFactory New | Rarely Traded62 days of listings ahead of you | 1.50.93/day counted · CSFloat | 82 | 28.1% | $20 | |
| 128 | 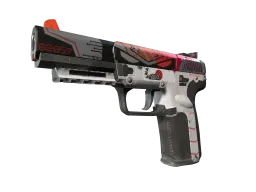 Five-SeveN | Boost ProtocolSTField-Tested Five-SeveN | Boost ProtocolSTField-Tested | Rarely Traded18 days of listings ahead of you | 7.82.5/day counted · CSFloat | 24 | 12.3% | $7.01 | |
| 129 | 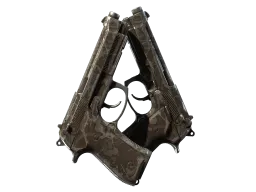 Dual Berettas | Oil ChangeField-Tested Dual Berettas | Oil ChangeField-Tested | Rarely Tradedbid/ask spread 42.2% | 1.70.17/day counted · CSFloat | 18 | 42.2% | $0.51 | |
| 130 | 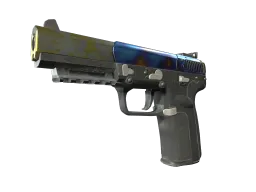 Five-SeveN | Case HardenedMinimal Wear Five-SeveN | Case HardenedMinimal Wear | Rarely Traded235 days of listings ahead of you | 4.25.2/day counted · CSFloat | 306 | 8.6% | $15 | |
| 131 | 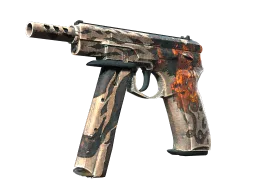 CZ75-Auto | CircaetusFactory New CZ75-Auto | CircaetusFactory New | Rarely Traded91 days of listings ahead of you | 7.11.3/day counted · CSFloat | 118 | 9.7% | $1.27 | |
| 132 | 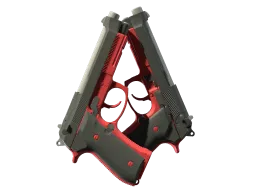 Dual Berettas | PantherMinimal Wear Dual Berettas | PantherMinimal Wear | Rarely Traded39 days of listings ahead of you | 7.03.1/day counted · CSFloat | 51 | 24.3% | $5.49 | |
| 133 |  P2000 | Imperial DragonSTMinimal Wear P2000 | Imperial DragonSTMinimal Wear | Rarely Traded41 days of listings ahead of you | 1.11.9/day counted · CSFloat | 53 | 26.9% | $14 | |
| 134 | 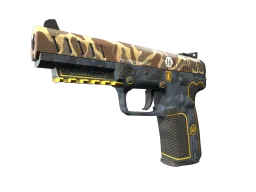 Five-SeveN | BuddyFactory New Five-SeveN | BuddyFactory New | Rarely Traded80 days of listings ahead of you | 7.02.6/day counted · CSFloat | 104 | 19.6% | $4.96 | |
| 135 |  Dual Berettas | HemoglobinFactory New Dual Berettas | HemoglobinFactory New | Rarely Traded108 days of listings ahead of you | 6.07.9/day counted · CSFloat | 140 | 3.3% | $15 | |
| 136 |  Glock-18 | Bunsen BurnerSTFactory New Glock-18 | Bunsen BurnerSTFactory New | Rarely Traded27 days of listings ahead of you | 3.32.2/day counted · CSFloat | 35 | 13.7% | $9.09 | |
| 137 | 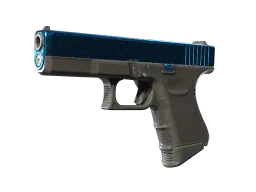 Glock-18 | Twilight GalaxyMinimal Wear Glock-18 | Twilight GalaxyMinimal Wear | Rarely Tradedbid/ask spread 45.3% · 61 days of listings ahead of you | <0.12.8/day counted · CSFloat | 69 | 45.3% | $243 | |
| 138 | 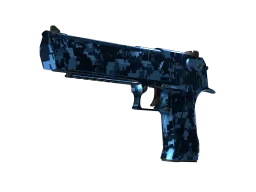 Desert Eagle | Cobalt DisruptionSTFactory New Desert Eagle | Cobalt DisruptionSTFactory New | Rarely Traded95 days of listings ahead of you | 0.202.9/day counted · CSFloat | 95 | 15.4% | $200 | |
| 139 | 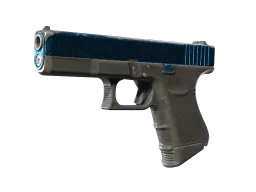 Glock-18 | Twilight GalaxyField-Tested Glock-18 | Twilight GalaxyField-Tested | Rarely Tradedbid/ask spread 76.9% · 21 days of listings ahead of you | <0.10.23/day counted · CSFloat | 18 | 76.9% | $251 | |
| 140 | 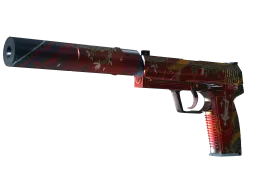 USP-S | The TraitorSTFactory New USP-S | The TraitorSTFactory New | Rarely Traded35 days of listings ahead of you | 0.100.83/day counted · CSFloat | 28 | 15.6% | $232 | |
| 141 |  Desert Eagle | Sunset Storm 壱Factory New Desert Eagle | Sunset Storm 壱Factory New | Rarely Tradedmedium confidence55 days of listings ahead of you | 0.770.70/day counted · CSFloat | 42 | 10.6% | $493 | |
| 142 | 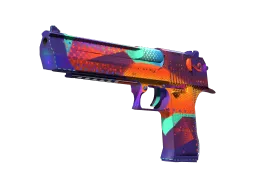 Desert Eagle | Ocean DriveFactory New Desert Eagle | Ocean DriveFactory New | Rarely Traded46 days of listings ahead of you | <0.10.63/day counted · CSFloat | 35 | 12.1% | $293 | |
| 143 | 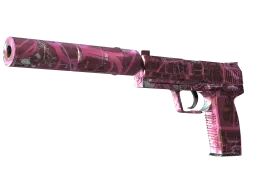 USP-S | Target AcquiredMinimal Wear USP-S | Target AcquiredMinimal Wear | Rarely Tradedmedium confidence41 days of listings ahead of you | 0.701.1/day counted · CSFloat | 29 | 15.6% | $235 | |
| 144 |  Glock-18 | Synth LeafFactory New Glock-18 | Synth LeafFactory New | Rarely Tradedmedium confidence139 days of listings ahead of you | 0.530.47/day counted · CSFloat | 74 | 35.9% | $391 | |
| 145 | 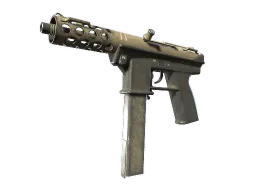 Tec-9 | Raw CeramicSVBattle-Scarred Tec-9 | Raw CeramicSVBattle-Scarred | Rarely Tradedmedium confidence | 0.47 | 1 | — | $23 | |
| 146 | 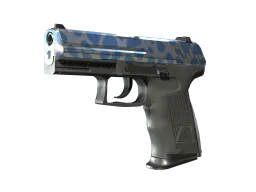 P2000 | Ocean FoamSTFactory New P2000 | Ocean FoamSTFactory New | Rarely Tradedmedium confidence86 days of listings ahead of you | 0.470.27/day counted · CSFloat | 40 | 33.8% | $244 | |
| 147 |  Desert Eagle | Fennec FoxSVWell-Worn Desert Eagle | Fennec FoxSVWell-Worn | Rarely Traded | 0.270.43/day counted · CSFloat | 6 | 20.8% | $163 | |
| 148 | 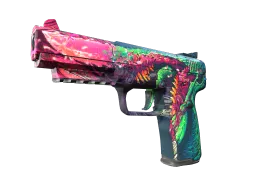 Five-SeveN | Hyper BeastMinimal Wear Five-SeveN | Hyper BeastMinimal Wear | Rarely Traded81 days of listings ahead of you | 0.200.60/day counted · CSFloat | 35 | 9.0% | $406 | |
| 149 |  Desert Eagle | Fennec FoxBattle-Scarred Desert Eagle | Fennec FoxBattle-Scarred | Rarely Tradedbid/ask spread 66.6% · 42 days of listings ahead of you | <0.10.37/day counted · CSFloat | 18 | 66.6% | $198 | |
| 150 |  Glock-18 | Bullet QueenSTFactory New Glock-18 | Bullet QueenSTFactory New | Rarely Traded42 days of listings ahead of you | 0.270.40/day counted · CSFloat | 18 | 10.2% | $170 |
How the rating is built
Three measurements decide it, and each one alone would mislead. Trade flow — units sold per day — sets the rating. Listing queue and spread can only pull it down, never lift it, because an item is never more liquid than its trade count supports.
The bias is deliberately toward caution. Days we did not observe count as zero trades. The queue is measured against the venue's own trades rather than every market pooled, because a queue only clears through the order book it sits in. And an item we have too little data on is left off this page rather than rated poorly — not knowing whether something sells is not the same as knowing it does not. See our methodology for where the underlying prices and volumes come from.
What each liquidity rating means
Ratings measure demand — units traded per day, against thresholds refitted to the live distribution, so the top band is rare on purpose. How long your listing waits also depends on the queue ahead of it, which the listings column counts. Roughly, in units sold per day:
The last one is not a rung on that ladder. At these prices a thin book is usually scarcity rather than indifference — a retired sticker or a rare pattern trades twice a year because almost none exist, not because nobody wants one — and Rarely Traded would tell its owner to cut the price, which is the one thing that does not apply. The rating still measures turnover; this only changes what a low turnover is taken to mean.
Frequently Asked Questions
What does liquidity mean for a CS2 skin?
How quickly you can sell it without cutting the price. It is a property of trade flow, not of price — an expensive skin is not automatically hard to sell, and a cheap one is not automatically easy. A knife worth thousands can change hands daily while a $3 skin sits for weeks.
How is this measured?
Units actually traded over the last 30 days, across the marketplaces we track plus the Steam Market. Those are separate order books, so their trade counts add. Three numbers decide the rating: daily trade flow, the listing queue ahead of you at the venue, and the gap between the best buy and sell price.
Why does a heavily traded skin sometimes rate lower?
Because flow alone can flatter an item. A skin trading 20 times a day with 600 listings ahead of yours is not a quick sale, and one with a 40% gap between buy and sell price is only liquid if you accept the lower number. A long queue or a wide spread pulls the rating down; nothing pulls it up. An item is never rated more liquid than its trade count supports.
Why is my skin missing from this page?
Either we have not recorded enough trading days for it — the floor is 10 days inside the 30-day window — or its trade data has not updated in over 7 days. Both cases mean we cannot tell how liquid it is, which is different from knowing it is illiquid, so it is left out rather than rated badly.
What does the listings column mean?
How many of the item are for sale at the reference venue right now — the queue your own listing joins the back of. We measure how long that queue would take to clear against that venue's own trades, because a queue only clears through the order book it sits in, and a queue longer than 14 days lowers the rating a band.
Does a high rating guarantee a fast sale?
No. It says the market has been absorbing that volume recently at the prices shown. Demand shifts, and your own listing price still decides whether you are at the front of the queue or the back. Treat it as a read on the market, not a promise about your sale.