
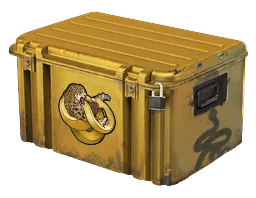
 Operation Broken Fang Case$5.56
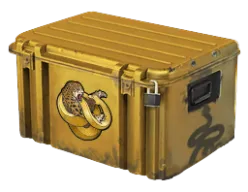
Operation Broken Fang Case
Active Demand76,997 listings−12% vs avg






































 SkinsMonkey$8.02 — site trade price
 CS.Money$5.51 — site trade price
 TradeIt$8.61 — site trade price
 PirateSwap$7.48 — site trade price
 Skinflow$5.16 — withdraw ask
 SkinSwap$8.64 — site trade price
 cs.trade— — no trade quote for this item
 DMarket$4.65 — exchange price
Show 4 more trading sitesShow fewer trading sites


Trend-10.9% over 30 daysTrend: -10.9% over 30 days. Open for the workings.
Today at $4.87 — 3.8% above the month's floor.






 $4.87Skinswap12% off. $4.90TradeIt12% off. $4.90
 CSFloat10% off. $5.00
 BUFF Market9% off. $5.04
 Skinport9% off. $5.08CS.Money8% off. $5.10
 Lisskins8% off. $5.10
 Moon Market
More periods
About the Operation Broken Fang Case
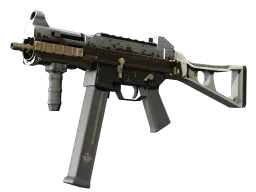
The Operation Broken Fang Case is a Base-grade container in Counter-Strike 2.
Origin
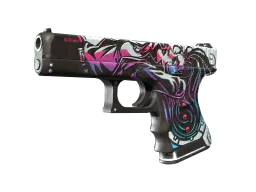
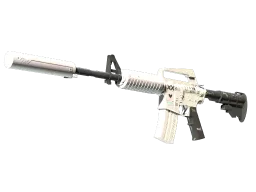
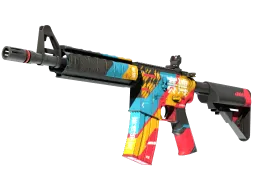
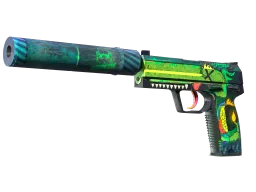
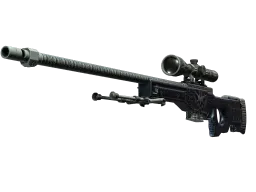
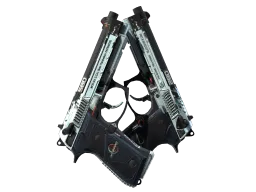
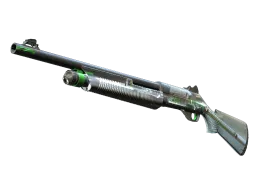
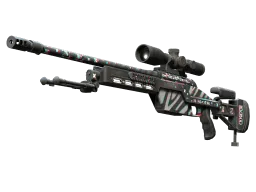
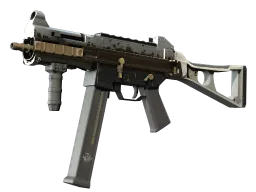
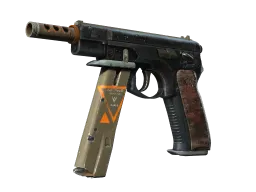
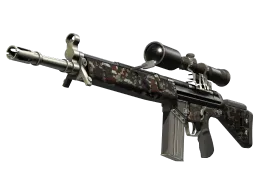
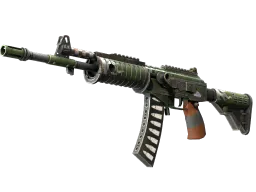
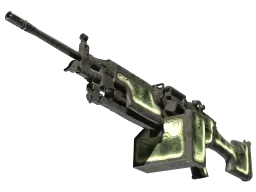
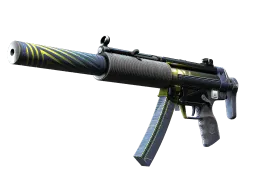
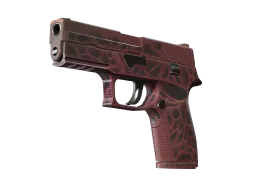
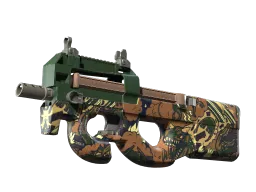
It contains weapon skins from The Operation Broken Fang Collection.
Price
The Operation Broken Fang Case has an aggregate market price of about $5.56. It is down 4.3% over 7 days and down 10.9% over 30 days.
Availability
32 marketplaces are quoting the Operation Broken Fang Case right now. The comparison table above lists each one with its lowest price, and the cheapest is marked.
Community rating
Readers rate the Operation Broken Fang Case 3.2 out of 5 from 296 votes.
Price Analysis
Current Trend
The Operation Broken Fang Case shows a Bearish trend. -10.9% (30d).
Market Position
Trades in the affordable range.
Traded Range
Since January 2025 it has traded between $4.72 and $12.75. Today's price is 56% below that high.
Market Comparison
Compare prices above. 5-20% differences exist due to fees.
Timing Insight
Prices trending down - potential buying opportunity. See charts for history.