

CS2 Sticker Market Trends
Every sticker we track, measured on the same daily reference price as the skins hub, over the same four windows and grouped by the tournament that issued it. Kept apart from skins on purpose: paper stickers move in whole percentage points and would otherwise own every list.
- 24H to 90D windows
- Daily reference prices
- Every view is a shareable link
Measuring stickers. Also: skins · cases & containers.
Broadly falling — 47% of tracked stickers are down over the last 7 days.
Sticker index · median tracked sticker, last 90 days, first day = 100
| Day | Index | Median price |
|---|---|---|
| 2026-08-21 | 100 | $10.95 |
| 2026-08-23 | 102.33 | $11.21 |
| 2026-08-24 | 101.78 | $11.15 |
| 2026-08-25 | 101.74 | $11.14 |
| 2026-08-26 | 96.44 | $10.56 |
| 2026-08-27 | 95.98 | $10.51 |
| 2026-08-28 | 99.63 | $10.91 |
| 2026-08-29 | 99.82 | $10.93 |
| 2026-08-30 | 100.18 | $10.97 |
| 2026-08-31 | 101.64 | $11.13 |
| 2026-09-01 | 99.09 | $10.85 |
| 2026-09-02 | 98.26 | $10.76 |
| 2026-09-03 | 98.26 | $10.76 |
| 2026-09-04 | 99.5 | $10.90 |
| 2026-09-05 | 98.17 | $10.75 |
| 2026-09-06 | 97.63 | $10.69 |
| 2026-09-07 | 99.22 | $10.87 |
| 2026-09-08 | 99.36 | $10.88 |
| 2026-09-09 | 98.9 | $10.83 |
| 2026-09-11 | 99.63 | $10.91 |
| 2026-09-12 | 98.9 | $10.83 |
| 2026-09-13 | 98.9 | $10.83 |
| 2026-09-14 | 97.12 | $10.64 |
| 2026-09-15 | 97.9 | $10.72 |
| 2026-09-16 | 100.87 | $11.05 |
| 2026-09-17 | 99.86 | $10.94 |
| 2026-09-18 | 100.46 | $11.00 |
| 2026-09-19 | 100.27 | $10.98 |
| 2026-09-20 | 104.93 | $11.49 |
| 2026-09-21 | 104.38 | $11.43 |
| 2026-09-22 | 104.57 | $11.45 |
| 2026-09-23 | 100 | $10.95 |
| 2026-09-24 | 100.18 | $10.97 |
| 2026-09-25 | 103.74 | $11.36 |
| 2026-09-26 | 97.72 | $10.70 |
| 2026-09-27 | 96.03 | $10.52 |
| 2026-09-28 | 96.8 | $10.60 |
| 2026-09-29 | 96.99 | $10.62 |
| 2026-09-30 | 96.71 | $10.59 |
| 2026-10-01 | 103.33 | $11.32 |
| 2026-10-02 | 104.02 | $11.39 |
| 2026-10-03 | 100 | $10.95 |
| 2026-10-04 | 97.26 | $10.65 |
| 2026-10-05 | 98.54 | $10.79 |
| 2026-10-06 | 99.09 | $10.85 |
| 2026-10-07 | 99.09 | $10.85 |
| 2026-10-08 | 100.55 | $11.01 |
| 2026-10-09 | 97.72 | $10.70 |
| 2026-10-10 | 97.81 | $10.71 |
| 2026-10-11 | 97.53 | $10.68 |
| 2026-10-12 | 101.19 | $11.08 |
| 2026-10-13 | 101.19 | $11.08 |
| 2026-10-14 | 99.41 | $10.89 |
| 2026-10-15 | 98.36 | $10.77 |
| 2026-10-16 | 98.63 | $10.80 |
| 2026-10-17 | 98.54 | $10.79 |
| 2026-10-18 | 98.36 | $10.77 |
| 2026-10-19 | 98.45 | $10.78 |
| 2026-10-20 | 97.76 | $10.71 |
| 2026-10-21 | 98.36 | $10.77 |
| 2026-10-22 | 97.35 | $10.66 |
| 2026-10-23 | 97.44 | $10.67 |
| 2026-10-24 | 98.72 | $10.81 |
| 2026-10-25 | 98.49 | $10.79 |
| 2026-10-26 | 98.45 | $10.78 |
| 2026-10-27 | 100.18 | $10.97 |
| 2026-10-28 | 99.18 | $10.86 |
| 2026-10-29 | 99.18 | $10.86 |
| 2026-10-30 | 98.9 | $10.83 |
| 2026-10-31 | 97.72 | $10.70 |
| 2026-11-01 | 98.86 | $10.83 |
| 2026-11-02 | 105.84 | $11.59 |
| 2026-11-03 | 100.64 | $11.02 |
| 2026-11-04 | 98.77 | $10.82 |
| 2026-11-05 | 98.54 | $10.79 |
| 2026-11-06 | 97.99 | $10.73 |
| 2026-11-07 | 98.36 | $10.77 |
| 2026-11-08 | 98.26 | $10.76 |
| 2026-11-09 | 97.08 | $10.63 |
| 2026-11-10 | 98.08 | $10.74 |
| 2026-11-11 | 96.62 | $10.58 |
| 2026-11-12 | 97.35 | $10.66 |
| 2026-11-13 | 96.62 | $10.58 |
| 2026-11-14 | 98.08 | $10.74 |
| 2026-11-15 | 97.81 | $10.71 |
| 2026-11-16 | 98.81 | $10.82 |
| 2026-11-17 | 98.08 | $10.74 |
| 2026-11-18 | 97.4 | $10.67 |
| 2026-11-19 | 96.53 | $10.57 |
Most Valuable · last 7 days
48 stickers











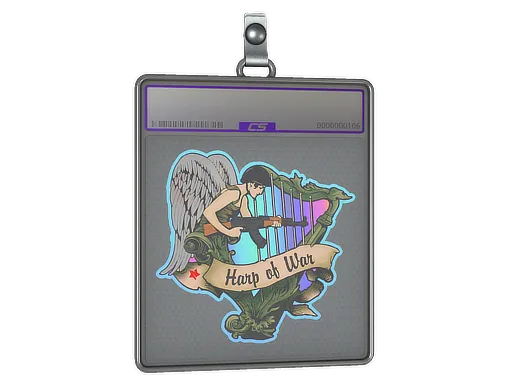










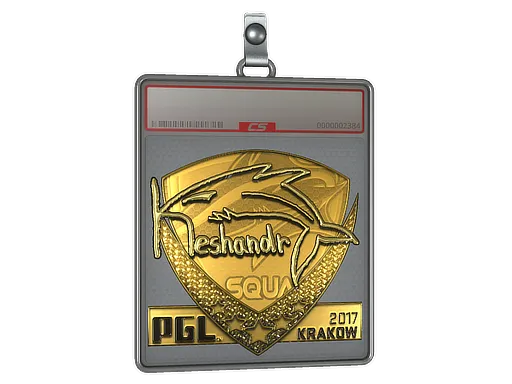





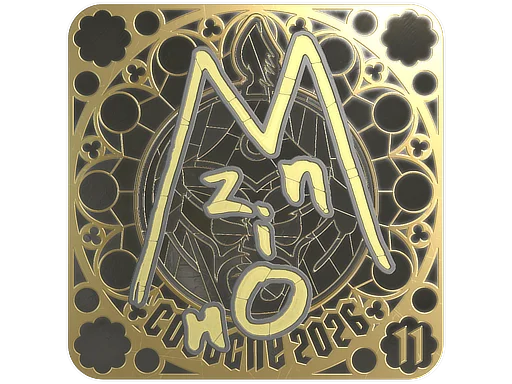







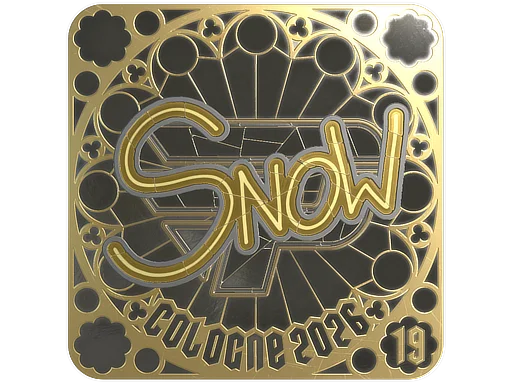







By tournament · median move, last 7 days
How to read this page
Why are stickers not on the main market trends page?
Because they would own it. A $0.30 paper sticker that ticks a cent moves three percent, and there are thousands of them, so a mixed list would be a sticker list. Measuring stickers on their own page keeps both rankings honest.
Why are stickers under $1 excluded?
Below a dollar a one-cent tick is more than a percent, which is the size of move the page counts as a trend, so the ranking would be measuring rounding. Above a dollar a tick is at most one percent. Most paper stickers sit under the floor; the holos, foils and golds that people actually trade sit above it.
What does the sold figure count?
Completed sales over the window at the two venues whose sales history we hold: Steam Market units from Steam’s own daily sales data, plus completed CSFloat sales. Steam does not list above about $1,800, so the rarest Katowice 2014 holos report no Steam sales however much they trade; where CSFloat recorded their sales, that count is the whole reading, and where it did not, the card says so.
How is the sticker index computed?
The median reference price across every tracked sticker priced above $1, per day over 90 days, indexed to 100 at the start of the window. A new capsule release entering the catalogue can step it; the copy says so rather than hiding it.
How are stickers grouped?
By the tournament in the sticker’s name, the same list /stickers uses. Stickers that belong to no tournament, such as community capsules, fall under Other.
The skins hub is at /market-trends; sourcing and calculations are in our methodology.