


CS2 Case & Container Market Trends
Cases, capsules, packages and boxes, measured on the same daily reference price as the skins hub, over the same four windows. Kept apart from skins on purpose: a cheap case moves in whole percentage points and would otherwise own every list.
- 24H to 90D windows
- Daily reference prices
- Every view is a shareable link
Mixed market — 42% up, 47% down over the last 7 days.
Container index · median tracked container, last 90 days, first day = 100
| Day | Index | Median price |
|---|---|---|
| 2026-06-06 | 100 | $15.15 |
| 2026-06-07 | 101.19 | $15.33 |
| 2026-06-08 | 102.38 | $15.51 |
| 2026-06-09 | 103.23 | $15.64 |
| 2026-06-10 | 102.44 | $15.52 |
| 2026-06-11 | 106.53 | $16.14 |
| 2026-06-12 | 103.86 | $15.74 |
| 2026-06-13 | 106.11 | $16.08 |
| 2026-06-14 | 103.76 | $15.72 |
| 2026-06-15 | 102.44 | $15.52 |
| 2026-06-16 | 103.5 | $15.68 |
| 2026-06-17 | 108.02 | $16.37 |
| 2026-06-18 | 106.77 | $16.18 |
| 2026-06-19 | 105.68 | $16.01 |
| 2026-06-20 | 103.63 | $15.70 |
| 2026-06-21 | 103.5 | $15.68 |
| 2026-06-22 | 102.11 | $15.47 |
| 2026-06-23 | 101.98 | $15.45 |
| 2026-06-24 | 103.43 | $15.67 |
| 2026-06-25 | 104.69 | $15.86 |
| 2026-06-26 | 99.87 | $15.13 |
| 2026-06-27 | 103.04 | $15.61 |
| 2026-06-28 | 101.25 | $15.34 |
| 2026-06-29 | 102.11 | $15.47 |
| 2026-06-30 | 99.8 | $15.12 |
| 2026-07-01 | 101.98 | $15.45 |
| 2026-07-02 | 104.55 | $15.84 |
| 2026-07-03 | 96.9 | $14.68 |
| 2026-07-04 | 100.79 | $15.27 |
| 2026-07-05 | 97.13 | $14.72 |
| 2026-07-06 | 99.27 | $15.04 |
| 2026-07-07 | 99.5 | $15.08 |
| 2026-07-08 | 99.34 | $15.05 |
| 2026-07-09 | 101.78 | $15.42 |
| 2026-07-10 | 98.45 | $14.92 |
| 2026-07-11 | 98.88 | $14.98 |
| 2026-07-12 | 99.34 | $15.05 |
| 2026-07-13 | 99.21 | $15.03 |
| 2026-07-14 | 101.25 | $15.34 |
| 2026-07-15 | 98.28 | $14.89 |
| 2026-07-16 | 96.5 | $14.62 |
| 2026-07-17 | 100.2 | $15.18 |
| 2026-07-18 | 97.43 | $14.76 |
| 2026-07-19 | 97.29 | $14.74 |
| 2026-07-20 | 94.32 | $14.29 |
| 2026-07-21 | 96.44 | $14.61 |
| 2026-07-22 | 98.48 | $14.92 |
| 2026-07-23 | 95.05 | $14.40 |
| 2026-07-24 | 99.21 | $15.03 |
| 2026-07-25 | 97.62 | $14.79 |
| 2026-07-26 | 96.44 | $14.61 |
| 2026-07-27 | 96.96 | $14.69 |
| 2026-07-28 | 96.96 | $14.69 |
| 2026-07-29 | 97.1 | $14.71 |
| 2026-07-30 | 97.62 | $14.79 |
| 2026-07-31 | 97.1 | $14.71 |
| 2026-08-01 | 98.15 | $14.87 |
| 2026-08-02 | 98.09 | $14.86 |
| 2026-08-03 | 101.72 | $15.41 |
| 2026-08-04 | 102.05 | $15.46 |
| 2026-08-05 | 99.11 | $15.02 |
| 2026-08-06 | 98.75 | $14.96 |
| 2026-08-07 | 98.55 | $14.93 |
| 2026-08-08 | 99.87 | $15.13 |
| 2026-08-09 | 98.75 | $14.96 |
| 2026-08-10 | 100 | $15.15 |
| 2026-08-11 | 98.84 | $14.98 |
| 2026-08-12 | 102.44 | $15.52 |
| 2026-08-13 | 97.13 | $14.72 |
| 2026-08-14 | 97.1 | $14.71 |
| 2026-08-15 | 97.49 | $14.77 |
| 2026-08-16 | 97.95 | $14.84 |
| 2026-08-17 | 98.22 | $14.88 |
| 2026-08-18 | 98.61 | $14.94 |
| 2026-08-19 | 96.6 | $14.64 |
| 2026-08-20 | 97.03 | $14.70 |
| 2026-08-21 | 96.96 | $14.69 |
| 2026-08-23 | 99.01 | $15.00 |
| 2026-08-24 | 97.43 | $14.76 |
| 2026-08-25 | 96.04 | $14.55 |
| 2026-08-26 | 97.06 | $14.71 |
| 2026-08-27 | 96.83 | $14.67 |
| 2026-08-28 | 96.44 | $14.61 |
| 2026-08-29 | 98.98 | $15.00 |
| 2026-08-30 | 96.63 | $14.64 |
| 2026-08-31 | 97.85 | $14.83 |
| 2026-09-01 | 97.26 | $14.74 |
| 2026-09-02 | 97.43 | $14.76 |
| 2026-09-03 | 97.49 | $14.77 |
| 2026-09-04 | 97.76 | $14.81 |
Top Losers · last 7 days
48 containers





























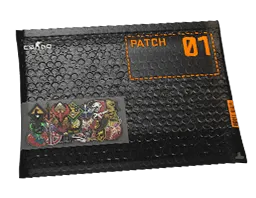


















By kind · median move, last 7 days
How to read this page
Why are containers not on the main market trends page?
Because they would own it. A $0.50 case that ticks a cent moves two percent, and there are hundreds of them, so a mixed list would be a case list with a few skins at the bottom. Measuring containers on their own page keeps both rankings honest.
Why are containers under $1 excluded?
Below a dollar a one-cent tick is more than a percent, which is the size of move the page counts as a trend, so the ranking would be measuring rounding rather than the market. Above a dollar a tick is at most one percent. The skins hub uses $5 for the same reason.
What does the sold figure count?
Completed sales over the window at the two venues whose sales history we hold: Steam Market units from Steam’s own daily sales data, plus completed CSFloat sales. Containers trade in the tens of thousands a day on Steam, so this is one of the few places on the site where the Steam figure describes most of the market; each card names how many came from which venue. Only complete days are counted.
How is the container index computed?
The median reference price across every tracked container priced above $1, per day over 90 days, indexed to 100 at the start of the window. Median rather than mean so a discontinued case at $300 does not dominate a market of $1 cases. A newly released case entering the catalogue can step the index; the copy says so rather than hiding it.
Where do the groups come from?
From the container’s name: weapon cases, sticker capsules, souvenir packages, music kit boxes, patch packs and graffiti boxes. Each group card shows the median price and median move across its members over the window.
The skins hub is at /market-trends; sourcing and calculations are in our methodology.