


Most sold CS2 cases this quarter
Copies that actually changed hands on CSFloat over the last 90 days, counted from completed sales rather than listings, and ranked on the count. One venue, named so the number means what it says.
| # | Item | Sold · 90d | Per day | vs prior | Active days | Price |
|---|---|---|---|---|---|---|
| 1 |  Dreams & Nightmares Case Base GradeContainer | 528,637 | 5,873.7 | -35.7% | 85/90 | $1.20 |
| 2 |  Fever Case Base GradeContainer | 461,663 | 5,129.6 | -71.4% | 85/90 | $0.61 |
| 3 |  Recoil Case Base GradeContainer | 333,687 | 3,707.6 | -70.9% | 85/90 | $0.30 |
| 4 |  Fracture Case Base GradeContainer | 332,017 | 3,689.1 | -27.9% | 85/90 | $0.48 |
| 5 |  Snakebite Case Base GradeContainer | 186,636 | 2,073.7 | -37.8% | 85/90 | $0.44 |
| 6 | 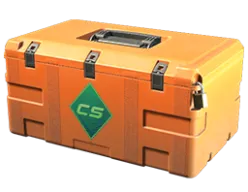 Gallery Case Base GradeContainer | 138,748 | 1,541.6 | -36.9% | 85/90 | $0.78 |
| 7 | 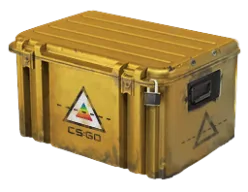 Prisma Case Base GradeContainer | 137,235 | 1,524.8 | -39.4% | 85/90 | $1.32 |
| 8 | 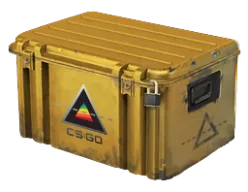 Prisma 2 Case Base GradeContainer | 135,097 | 1,501.1 | -28.9% | 85/90 | $1.29 |
| 9 | 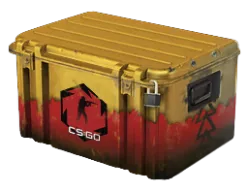 Danger Zone Case Base GradeContainer | 125,985 | 1,399.8 | -32.6% | 85/90 | $1.19 |
| 10 |  Clutch Case Base GradeContainer | 122,387 | 1,359.9 | -25.5% | 85/90 | $0.55 |
| 11 |  Horizon Case Base GradeContainer | 53,252 | 591.7 | -34.7% | 85/90 | $1.63 |
| 12 |  CS20 Case Base GradeContainer | 51,413 | 571.3 | -42.8% | 85/90 | $1.03 |
| 13 |  Chroma 3 Case Base GradeContainer | 45,887 | 509.9 | -15.2% | 85/90 | $3.41 |
| 14 |  Revolver Case Base GradeContainer | 39,440 | 438.2 | -28.1% | 85/90 | $2.80 |
| 15 |  Operation Breakout Weapon Case Base GradeContainer | 37,576 | 417.5 | -16.5% | 85/90 | $7.96 |
| 16 |  Glove Case Base GradeContainer | 34,738 | 386 | -19.7% | 85/90 | $13.10 |
| 17 |  Gamma 2 Case Base GradeContainer | 34,041 | 378.2 | -30.7% | 85/90 | $3.10 |
| 18 |  Chroma 2 Case Base GradeContainer | 31,162 | 346.2 | -24.2% | 85/90 | $3.69 |
| 19 |  Gamma Case Base GradeContainer | 29,478 | 327.5 | -26.0% | 85/90 | $3.17 |
| 20 |  Shadow Case Base GradeContainer | 18,478 | 205.3 | -36.8% | 85/90 | $1.80 |
| 21 |  Operation Wildfire Case Base GradeContainer | 15,796 | 175.5 | -23.7% | 85/90 | $3.22 |
| 22 | 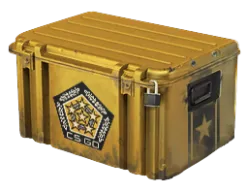 Chroma Case Base GradeContainer | 11,623 | 129.1 | -24.9% | 85/90 | $4.60 |
| 23 | 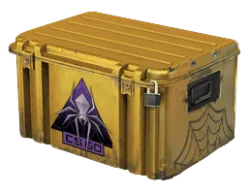 Shattered Web Case Base GradeContainer | 8,578 | 95.3 | -51.6% | 85/90 | $4.59 |
| 24 | 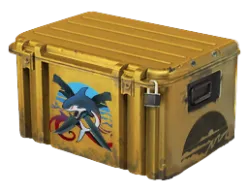 Operation Riptide Case Base GradeContainer | 4,433 | 49.3 | -45.5% | 85/90 | $9.48 |
| 25 | 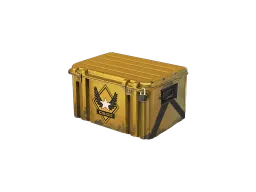 Winter Offensive Weapon Case Base GradeContainer | 2,055 | 22.8 | -31.7% | 85/90 | $9.57 |
| 26 | 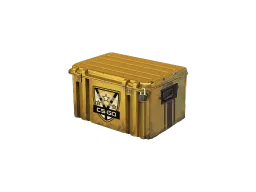 Huntsman Weapon Case Base GradeContainer | 1,998 | 22.2 | -49.3% | 85/90 | $8.78 |
| 27 | 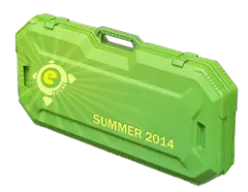 eSports 2014 Summer Case Base GradeContainer | 1,679 | 18.7 | -57.2% | 85/90 | $12.77 |
| 28 | 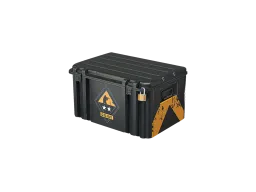 CS:GO Weapon Case 2 Base GradeContainer | 1,121 | 12.5 | -36.2% | 85/90 | $23.46 |
| 29 | 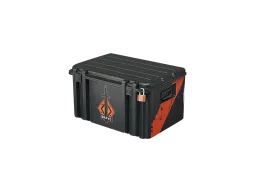 Operation Bravo Case Base GradeContainer | 1,091 | 12.1 | -25.6% | 85/90 | $58.94 |
| 30 | 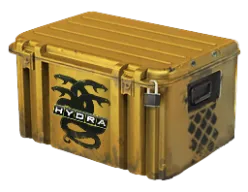 Operation Hydra Case Base GradeContainer | 1,047 | 11.6 | -47.5% | 85/90 | $30.86 |
Completed sales on CSFloat, summed over the window. “Per day” is the count over the window length; “vs prior” compares against the window of the same length before it. Price is the SteamAnalyst reference price, not the sale price. The pool is the 2,000 most-sold names, narrowed by type afterwards; 35 of them have no catalogue entry and are left out.
How to read this board
What is being counted?
Completed sales on CSFloat, one row per item per day, summed over the window you picked. A sale is a copy that changed hands; a listing that was withdrawn or repriced does not count. It is one marketplace, so the numbers are a floor on how much an item trades, not the whole market.
How is this different from the liquidity rankings?
The liquidity board scores how readily an item sells from several feeds — Steam volume, listing turnover, BUFF rank, spread — and expresses that as a tier. This board does not score anything. It counts sales at one venue and ranks the count. Where the two disagree, the liquidity board is modelling and this one is measuring, and each says which.
Why are cases at the top?
Because they are. Cases and capsules are the most-traded items in the game by a wide margin: cheap, uniform and bought in bulk. Use the type chips to see the busiest knives, gloves or rifles on their own.
What does "vs prior" mean?
The change against the window of the same length immediately before — this week against last week, this month against last month. A dash means the history does not reach back far enough to compare.
Why does the page sometimes say the data is behind?
The sales feed is loaded from a collector once a day. When the newest day it holds is more than 3 days old, the board says so above the table rather than presenting older counts as this week's.
Why does a chip show fewer than 100 items?
The board ranks the 2,000 most-sold names first and then narrows by type, so a chip shows every item of that type inside the busiest 2,000. A knife that sold twice this week is not in that pool, and that is the honest answer about how much it trades.